



We find where your money slips away
Process mapping & optimization
We follow the order flow across departments, put a number on every delay and rank the changes by payback.
Where it gets stuck
From the outside, everything looks fine
Ask five people where work gets stuck. You get five answers, and every one of them is true.
| How operations look in the report | What mapping shows |
|---|---|
| Orders | Data from emails is retyped by hand, sometimes twice |
| Approvals | Approvals sit somewhere and nobody knows with whom |
| Tools | Every department bought its own |
| Vendors | They delivered their part, and the work is still stuck |
| Licenses | Some nobody has logged into all year |
| Margins | Unknown for some of your orders |
How the mapping runs
We walk the operation and return with numbers you can decide on
We start with what people complain about. One department takes 2–3 weeks, the whole order flow 4–8 weeks.
- First
We walk the operation
We come in and draw how the work really runs, including the steps outside the official rules.
- As we go
We mark where work waits
Manual retyping, unused licenses, decisions without evidence.
- Then
We turn it into money
Every delay is converted into hours and money per year.
- At the end
We rank by payback
What pays for itself first ends up at the top.

What we map with
Orgus interviews everyone who works in the process
A workshop shows how leadership sees the process. Orgus – our own tool – interviews everyone involved in it. By voice or text, at their own pace. From the interviews it assembles one map of how work really runs, marks where people’s views diverge, and compares reality with the target state. We add the numbers and the order of changes.
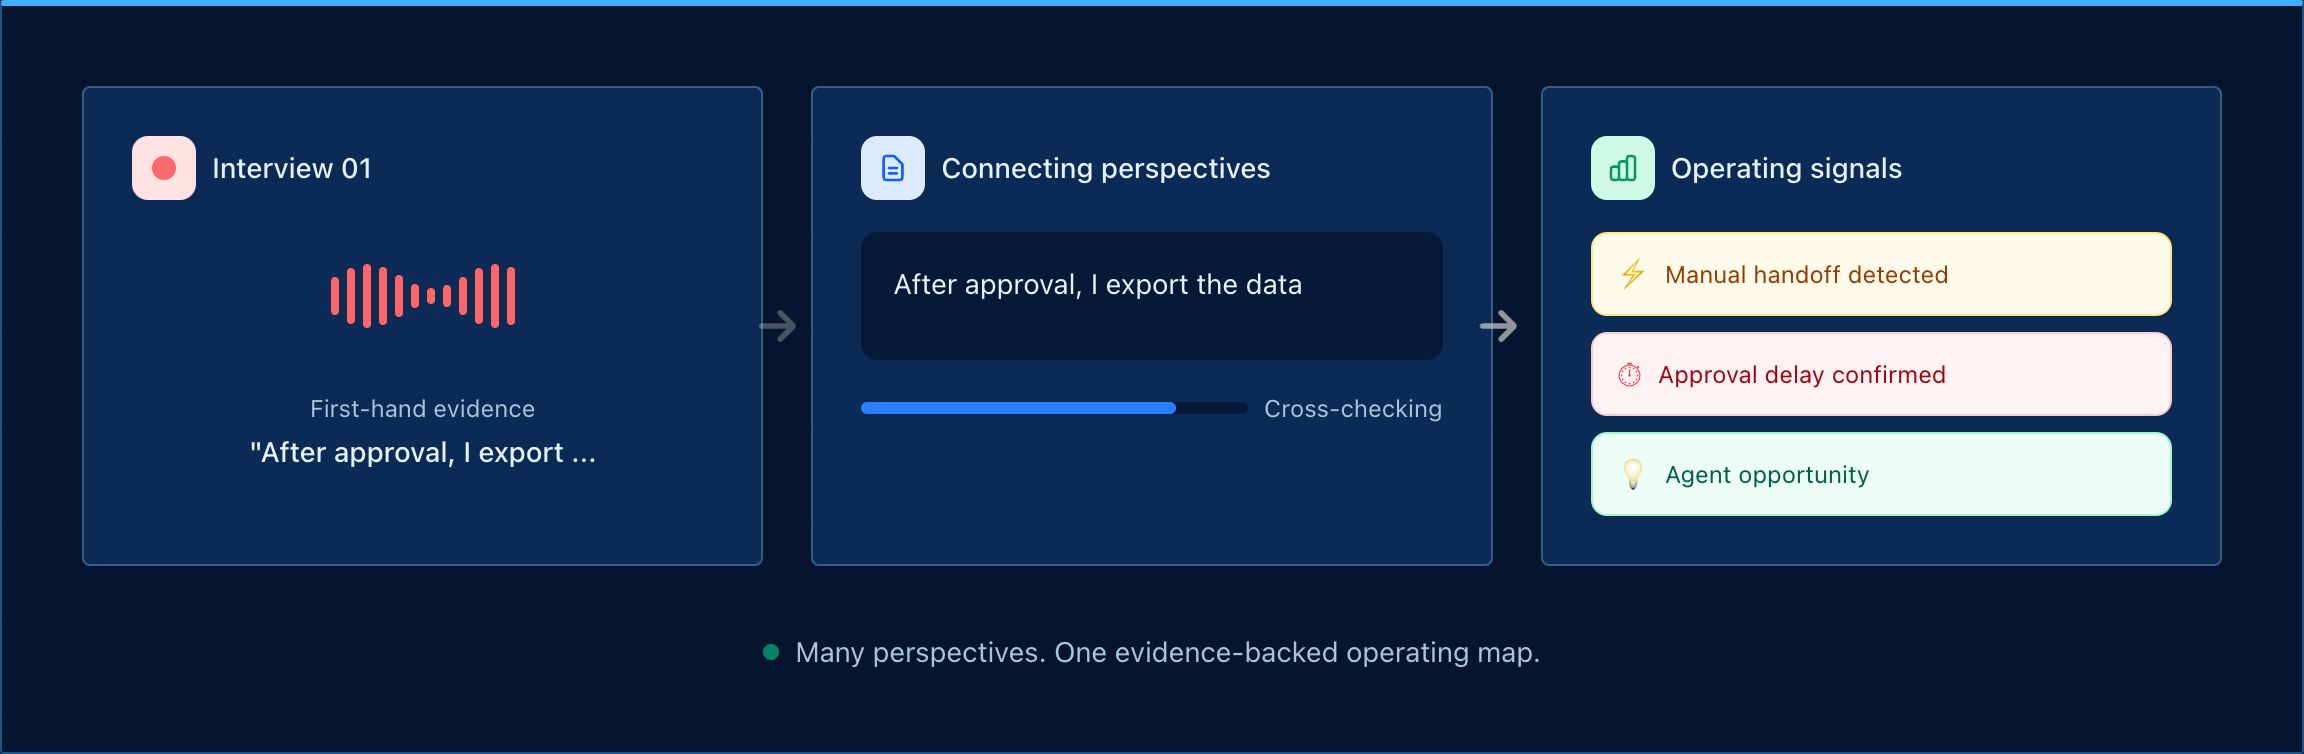
We tell you whether to map the whole flow or whether one department is enough.
What you get
Four outputs you keep working with
You can stop at the map. Or we carry out the changes with you.
Current-state map
People, handoffs, tools, data and costs in one picture.
Losses in numbers
What slows you down and what it costs per year.
Plan with the order of changes
Ranked by savings, effort and risk.
Changes carried out
We connect systems, automate routine work, and add software or AI agents.
The other services
The map says what to change first. These three services carry it out.
Interim IT & AI leadership
No one on your team has a firm grip on IT? An experienced interim CTO joins within a month, aligns people and vendors, and hands IT back to you once everything runs on its own.
Start within a month · 1–2 days a week or full-time · usually 6–12 months · ends with a handover
AI agents & automation
A routine eats hours every day. We build an agent that takes it over and connects to the software you already use.
First working automation live in 2–4 weeks · then you decide whether to continue
Custom software development
You need an e-shop, a portal or a mobile app. We bring the team that builds it from sketch to launch.
Analysis before the contract · start within a week of signing · a milestone is one month and you pay per milestone
Proof
The method is the same in construction, energy and finance.
 In progress
Construction company
Process automation and mappingWe began with a script for Stavario attendance exports for payroll. Next: a process map across Helios, RSV and Stavario, plus virtual assistants.
 In progress
Energy supplier contact center
Project leadership and AI development for the contact centerWe are modernizing an energy supplier's contact center with a knowledge base and AI assistance in the client's Azure tenant. Since May 2026.

Home Credit
Technical analysis and roadmapPartner integrations of Home Credit's installment API took too long. We audited the API, walked the onboarding as a developer and ranked the fixes.